
Ontario in present-day Canada (Wikipedia)
Stephen Harper might be representing Calgary Southwest, but his government hinges on Ontario – in the 2011 election, 73 of the CPC‘s 166 seats came from among Ontario’s 106 seats. Alberta contributes a paltry 27 (of its 28 seats) to the cause. This made me wonder, though I’m nigh-absolutely certain I’m not the first to wonder: Is it possible to win without winning Ontario – and therefore, from the runner-up perspective, win Ontario and not win in Canada overall? (Spoiler: Yes.)
In 2011, Ontario held 38.4% of our national population. Quebec is a distant second at 23.6%. If you didn’t get Ontario, can you win without Quebec? (Spoiler: Yes, but it’s vanishingly rare.) And finally, does getting both Ontario and Quebec ‘guarantee’ you’ll win? (Spoiler: Surprisingly, no.)
Deciding what constitutes a minority government is sometimes difficult: here’s a list of minority governments in Canada. I’m not going to spend much time distinguishing between minorities and majorities – for me, a plurality is a win. Even when it sort of isn’t.
Important note: The early elections were much different from today’s, both ethically and procedurally. I only talk about winning, not how the wins were won, if you follow me. Elections Canada has a web-book, A History of the Vote in Canada, whose second chapter talks about early elections and their questionable practices.
Ontario Winners who Didn’t Win it All & Other Stuff
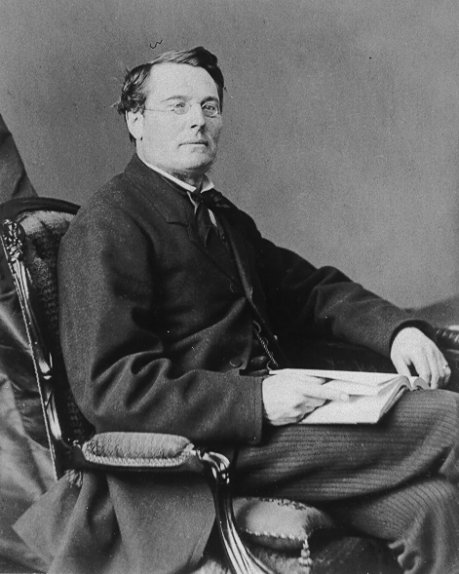
Edward Blake won Ontario in 1872 but it wasn’t enough. (Wikipedia)
In 1872 (election #2), the Liberals, unofficially under Edward Blake, took 48 seats in Ontario, while the designated Conservatives and Liberal-Conservatives took only 38, yet won 99 seats nationally to the Liberal’s 95, so John A. Macdonald remained in power. The Conservatives did take the Ontario popular vote, though: 37.8% to 35.3%.

John A. Macdonald, Canada’s first Prime Minister, won six out of the first seven elections, five of those with Ontario. – Canadian $10 note, Frontier Series
In 1891 (election #7), Liberals under Wilfrid Laurier (we’ll get to him more in a second) led the popular vote in Ontario (49.1%), but won only 44/92 seats in Ontario and only 90/215 seats nationwide. Designated Conservatives and Liberal-Conservatives combined for 46 seats in Ontario with only 47.5% of the popular vote and won 117 seats nationwide. This was John A. Macdonald’s sixth and final election victory (only loss was in 1874) – he died in office later the same year and can be found on the $10 bill today. This 7th Canadian Parliament ended up being led by five different Prime Ministers! Well, technically Tupper never sat, so four. Still.
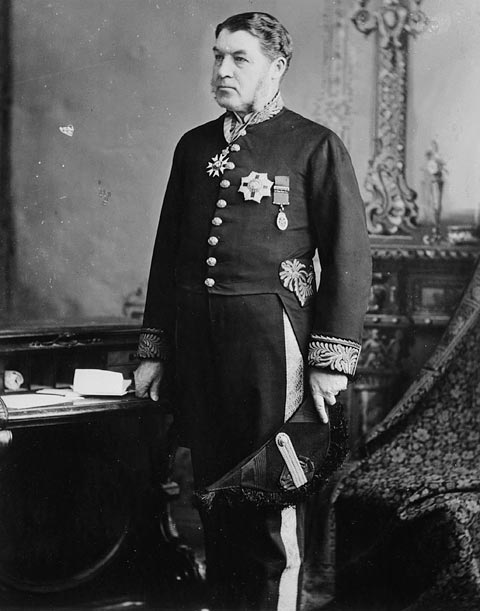
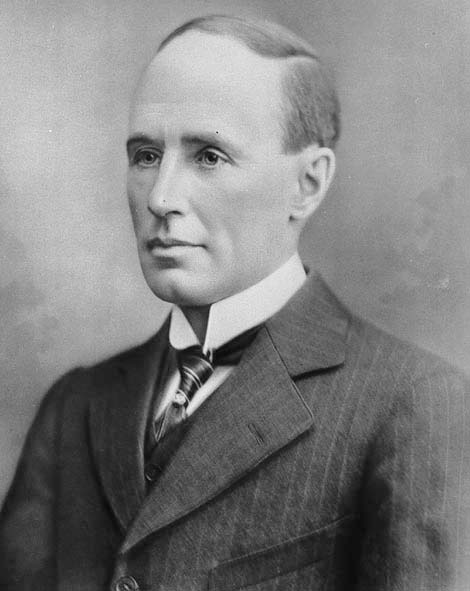
Charles Tupper, last man standing going into the 1896 election, though this dapper photo is from 1883. Won the poplar vote in Ontario. (Wikipedia)
In 1896 (election #8), the Conservative/Liberal-Conservatives in Ontario won the popular vote 44.9% to the Liberal’s 40.5%, but only won 41 seats to the Liberal’s 43. The Liberals of Wilfrid Laurier (the $5 bill guy and the first francophone PM) won 117/213 nationwide and formed a majority government… eventually. Incumbent PM Charles Tupper initially refused to cede power, but Governor General Lord Aberdeen stopped the insanity. In defense of Tupper, his candidates did win the popular vote 48.17% to 41.37%, and he did have the theoretical right to try to keep his government going. But trying to govern without either a plurality or enough support to be a de facto majority seems insane to me. His 69 days as Prime Minister make for the shortest federal premiership in Canadian history, and, like John Turner and Kim Campbell, he never sat in Parliament while officially Prime Minister.

Wilfrid Laurier won four consecutive majority governments, but only for the first did he win the Ontario seat count. – Canadian $5 note, Frontier Series
In 1900, Laurier’s Liberals won a second consecutive majority with 128/213 seats, but failed to win the seat count or popular vote in Ontario: 34 seats to 54, 46.7% to 48.7%. They kicked butt generally, though, winning 50.3% of the nationwide popular vote. This is the first election where the overall winner didn’t get either the seats or popular vote in Ontario. The Conservatives were led by Tupper.
Similar story in 1904: Laurier’s Liberals won a third consecutive majority with 137/214 seats while failing to win the seat count or popular vote in Ontario: 37 seats to 47 (of 86 seats now, not 92), 47.5% to 48.4%. They won a majority of the popular vote once again, bringing in 50.9%. The Conservatives were led by Robert Borden (we’ll hear more from him).
And in 1908 they roll on still: a fourth consecutive majority with 133/221 seats, still failing to win the seat count or popular vote in Ontario: 37 seats to 47, 45.0% to 50.7%. Borden continued to lead the Conservatives.

It’s all about the Bordens, baby. – Canadian $100 note, Frontier Series
Robert Borden, a Conservative (but a Liberal until 1891), was Prime Minister from 1911 through 1920 and always won Ontario for his premierships. I mention him here because he’s on the $100 bill and I mention the other three PMs on our drug money. He presided during a serious altercation in Europe in which we lost 67,000 people. (Newfoundland, then a separate Dominion, lost at least 1,300. Edward Morris was their Prime Minister.) For the 1917 election, Borden had formed the pro-conscription Unionist Party, which some pro-conscription Liberals joined (but not Laurier, who was opposed to conscription).
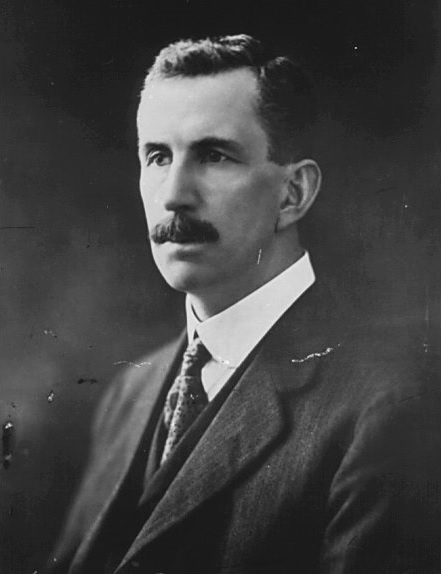
Thomas Crerar, Progressive Party leader in 1921. They finished ahead of the Conservatives, 58 seats to 49. (Wikipedia)
1921 marks the emergence of the Progressive Party and another break from WO,WIA. Canada’s first female MP, Agnes Macphail, won election for the first time in Grey Southeast. For Ontario as a whole, the Conservatives led by Arthur Meighen (a bit of a hard-luck case, as we’ll see) won the seats and the popular vote 36/82 and 38.8%, but the Liberals got 118/235 nationally and W. L. Mackenzie King was able to govern about as if he had a stable majority because the Progressives didn’t take kindly to the whip and so he could find enough Progressives to support him on crucial votes. (I suppose the problem with being against the whip is that you can be made into pawns of the parties that retain it.)
Arthur Meighen won the Ontario seat count in three consecutive elections: 1921, 1925, 1926. It didn’t do him a whole lot of good. (Wikipedia)
1925 was a delightful mess. Arthur Meighen‘s Conservatives won Ontario both ways, 67/82 and 56.3%, and won a plurality nationally, 115/245. Trouble is, WLMK figured he could keep on trucking with the support of the Progressives, and for a while he did. Perhaps he might have survived if one of his appointees hadn’t been found to have been accepting bribes! King asked the Governor General Baron Byng of Vimy to dissolve Parliament and force an election. Byng was like, “Wut? So soon? Ya gotta give someone else a stab at it.” King resigned and Byng invited Meighen to form a government. Meighen did so, but King rallied the Progressives and defeated it. With both King and Meighen having had their chances (and Progressive leader Robert Forke having only 22 seats), Byng called an election.
(You might be wondering why Paul Martin couldn’t have similarly held on in 2006. He would have had to have brought in all of the NDP MPs and some of the Bloc MPs. And on top of that, they and the CPC had triggered that election on the a motion of no confidence, so it would have been political suicide all around. Perhaps it would have been (made to be) palatable if there had been significantly more NDP MPs. Anyway, even though the 2006 Liberals lost overall, they did win Ontario, 54/106, 39.9%.)
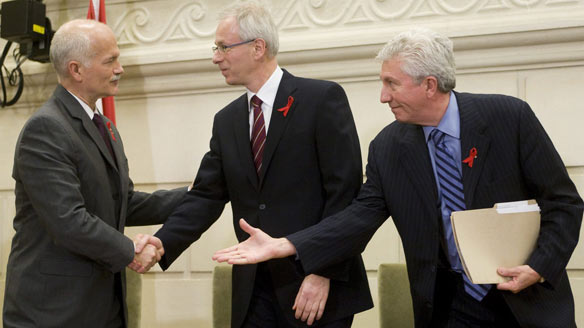
Jack Layton (NDP), Stéphane Dion (Liberal), and Gilles Duceppe (Bloc) were prepared to partner to form a coalition government in 2008. (Written on the Body)
(A Liberal-NDP–Bloc coalition (though the Bloc were pledging to limit themselves to being butts-in-seats partners for confidence votes only) nearly came about shortly after the 2008 election after the opposition parties condemned a fiscal update in light of the economic crisis (eliminating per-vote subsidies for political parties was probably a bit of an overreach, but that wasn’t all). Governor General Michaëlle Jean allowed Parliament to be prorogued until the new year, and so CPC PM Stephen Harper had a chance to get his ducks back in a row, by which time the Liberal share of the fire had gone out of the coalition movement, largely thanks to Michael Ignatieff. Liberal leader Stéphane Dion was already in the process of stepping down and therefore wasn’t able to sustain the coalition pressure into the new year. At least that’s what it looked like. I’m open to hearing differently when the memoirs are all out. Until this writing I’ve been vehemently uncharitable with regards to Michaëlle Jean’s decision, but even with it, Harper and the CPC wouldn’t have been able to remain in power if the Liberals themselves hadn’t backed off the coalition, so it’s not like she herself was propping up Harper. Blame or praise Iggy. j/k)
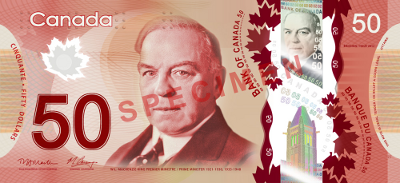
William Lyon Mackenzie King, Canada’s longest-serving and almost-longest-named Prime Minister. Contested seven elections, won five outright, held power after six. Only won the Ontario seat count twice: 1935 and 1940. – Canadian $50 note, Frontier Series
In 1926, the WLMK Liberals won a plurality again, 116/245, but the Conservatives under Meighen retained the edge in Ontario, winning 53/82, 54.9%.
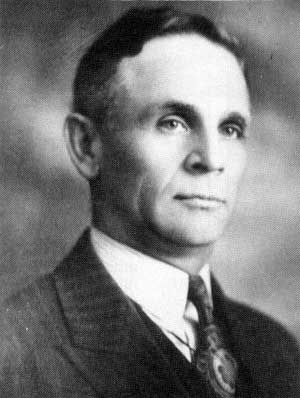
John Bracken won 48/82 seats in Ontario in 1945, but only 67/245 in Canada overall (Wikipedia)
In 1945, the Progressive Conservatives under John Bracken won Ontario 48/82, 41.4%, but lost overall to the WLMK Liberals who got a plurality of 118/245 seats. This was WLMK’s swan song: He held power after every election he contested as Liberal leader except for 1930, and served as PM for an astonishing 22 years. Today, he can be found on the $50 bill, if you can find an ATM that begrudgingly dispenses them and appease it with the correct incantations.
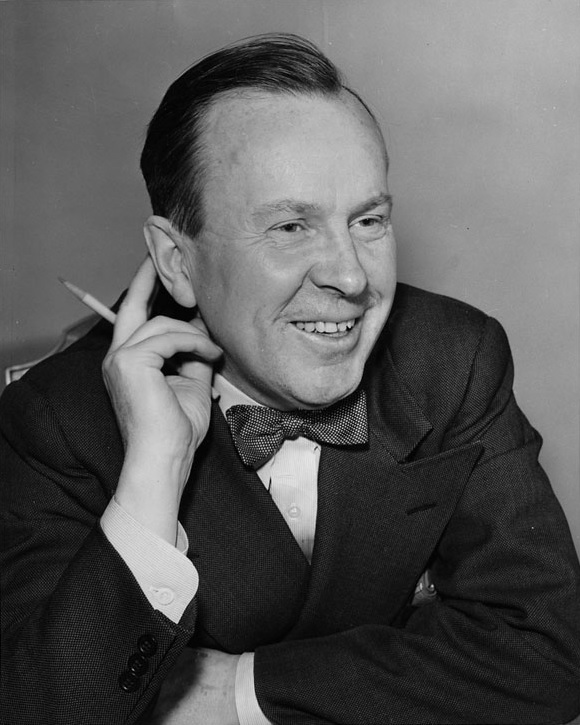
Lester B. Pearson won the Ontario seat count in three consecutive elections and governed after each of the second two. (Wikipedia)
In 1962, Lester B. Pearson‘s Liberals reduced the Progressive Conservative PM John Diefenbaker to a minority government. (Diefenbaker had won by huge 208/265, 53.66% margins in the snap election of 1958.) This election was also the high-water mark for the Social Credit Party. The Liberals won Ontario 43/85, 41.0% (and won Quebec 35/75, 39.2%!) but finished 99/265 overall to the Conservative’s 116. Pearson went on to win his own governments (winning Ontario each time), introduce national health care, keep us out of Vietnam, abolish capital punishment, and get an airport named after him, thus enshrining his name as a pejorative. This dubious honour was subsequently done to notable federal politicians Pierre Trudeau and Robert Stanfield, as we were out of bank notes to put them all on. Anyway, Pearson in 1962 is the only leader to win both Ontario and Quebec but still lose the overall election.
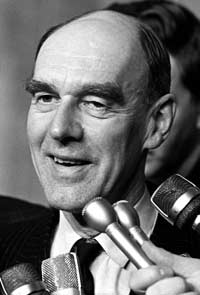
Robert Stanfield, pictured here while Premier of Nova Scotia, won the Ontario seat count in 1972 and very nearly won it all. (CP photo fair-used on Wikipedia)
Speaking of Pierre Trudeau, in 1972 his majority was reduced to a minority while Stanfield’s Progressive Conservatives won Ontario 40/88, 39.1%. On election night it looked like Stanfield had it, but when the dust settled he finished 107 to Trudeau’s 109.
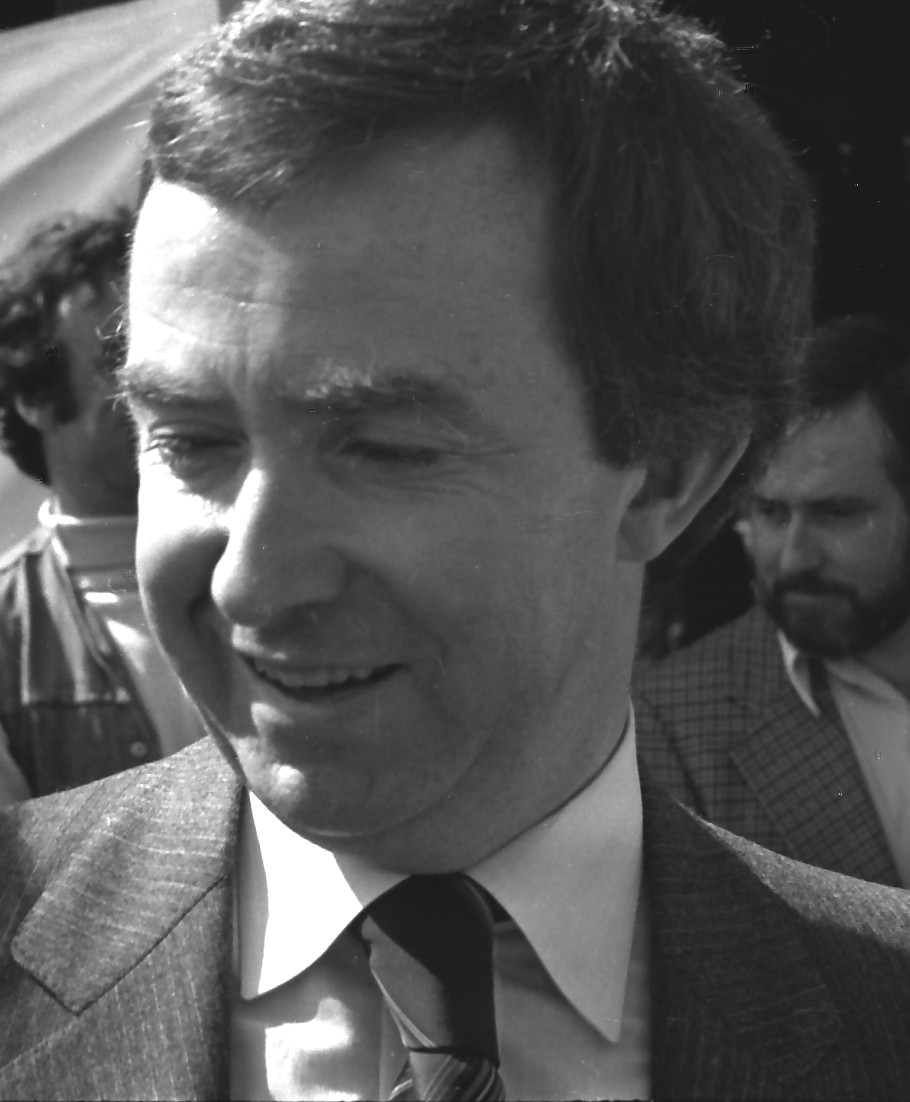
Joe Clark won Ontario and… well… (Wikipedia)
Joe Clark‘s Progressive Conservatives won a plurality in 1979 and won Ontario, but his tenure as PM in Parliament only lasted 66 days and had limited impact (as Clark’s finance minister John Crosbie will tell you, they didn’t pass a budget), but I’ll still count it towards our WO,WIA idea – as John Crosbie will also tell you, they might have been able to last if they’d used a little more finesse.
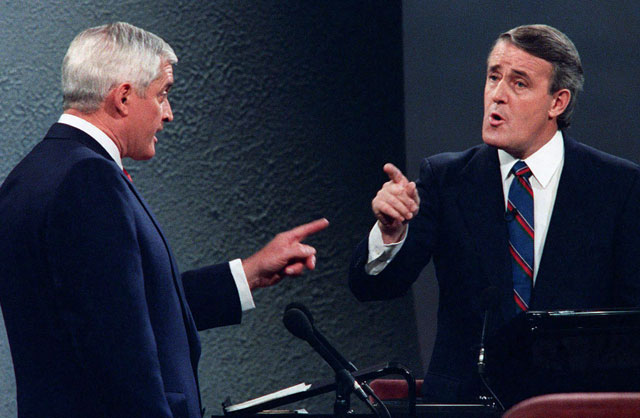
1988 debate, over free trade: John Turner (Liberal), Brian Mulroney (PC) (CP photo at CBC) Someone uploaded a few key minutes of the debate. CBC has the whole thing plus a highlight package.
In 1988, Brian Mulroney’s Progressive Conservatives won the Ontario seat count with 46 out of 99 on their way to a second consecutive majority government, but were edged by the John Turner Liberals in the Ontarian popular vote, 38.9% to 38.2%. Turner had been, very briefly, Prime Minister before very badly losing the 1984 election to Mulroney, so at least this was a modest comeback.
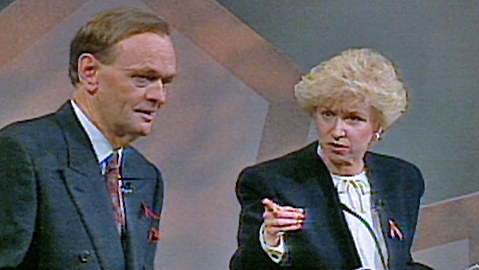
1993 debate, Jean Chrétien (Liberal) and Kim Campbell (PC) pictured. (CBC: Full Debate / Highlights)
Jean Chrétien, Liberal, won 52.9% of the popular vote and all but one seat in Ontario in 1993. I have to mention this election because it’s the first federal one I really paid any attention to. My father was a delegate in the 1993 PC leadership election, and I was going into grade 7 during that process and the subsequent election, which my younger self probably still has nightmares about. The Progressive Conservatives went from 154 seats to 2. T w o. TWO! Out of 295. The Liberals went from 96 to 177. All of a sudden there were five parties where there used to be three. If I were a grad student I’d probably try to do a thesis on it. No doubt others have. (A few years ago, I went to the Provincial Archives and typed out the GRITSKREIG! front-page story from the Mail-Star of the day.)
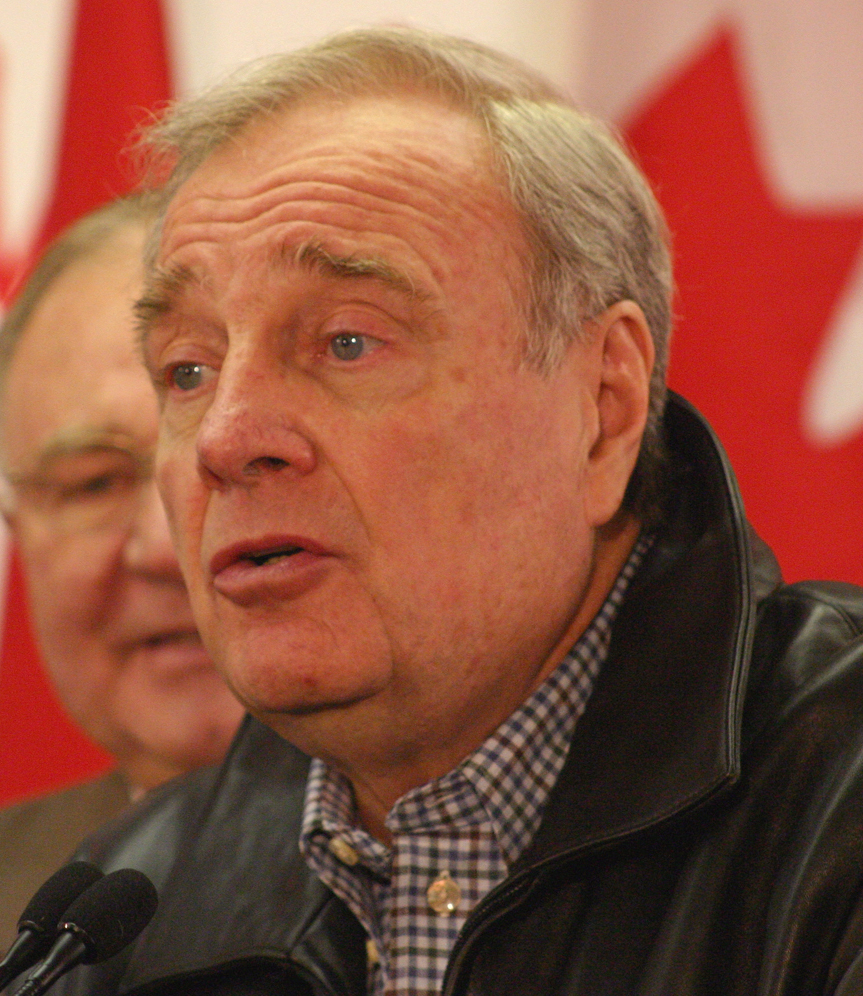
Paul Martin in 2006 (Wikipedia)
And now we’re back to 2006, where, as noted previously, Paul Martin won Ontario 54/106 in seats and 39.9% in popular vote, but lost the overall race 103 seats to 124. Stephen Harper of the CPC went on to form a minority government.
Will Canada’s next election win include a win in Ontario? I’d guess “yes”, but stay tuned. Polling averages crunched by Threehundredeight.com suggest a Liberal minority that wins in Ontario, 53/121 seats and 37.4% popular vote, but this is for Feburary 2014, and that “2015” writ drop is probably a long way away. But you never know.
Conclusion: Unless your portrait is on our money, you’d better win the seat race in Ontario. In only 10 elections out of 41 has a winner won in spite of not winning Ontario, and four of them are considered minorities (1921, 1962, 1972, 2006). In the other 31, 75% of all elections, the winner won Ontario. I count Meighen-1925 among these because of his plurality and because he did get to try to govern, albeit not immediately.

Flag of Quebec (Wikipedia)
The Quebec factor: In the 10 elections where the winner didn’t get the most seats in Ontario: 1872, 1900, 1904, 1908, 1921, 1926, 1945, 1962, 1972, 2006 – only the 1962 (Diefenbaker) and 2006 (Harper) victories were won in spite of winning neither Quebec nor Ontario. As mentioned before, in 1962 Pearson won both Quebec and Ontario, making him the only party leader in Canadian history to take both but fail to win the country. But he became Prime Minister the very next year, so it’s not a tragic tale, really.
Further viewing:
Numbers below and above were pulled from the individual Wikipedia articles for Canada’s 41 elections.
Win Ontario, win it all?
List of Canadian elections of which party leader won the most seats in Ontario compared with which party leader won the most seats in Canada overall.| Election Year | Ontario Winner | Ontario Winning Seats | Ontario Winning Popular Vote % | Canada Winner | Notes |
|---|---|---|---|---|---|
| 1867 | J.A.Macdonald | 49/82 | 38.7% | J.A.Macdonald, 100/180 | |
| 1872 | E.Blake (Seats), J.A. Macdonald (Vote) | 38/88 | 37.8% | J.A.Macdonald, 99/200 | |
| 1874 | A.Mackenzie | 61/88 | 39.6% | A.Mackenzie, 129/206 | |
| 1878 | J.A.Macdonald | 60/88 | 41.3% | J.A.Macdonald, 134/206 | |
| 1882 | J.A.Macdonald | 52/92 | 36.1% | J.A.Macdonald, 133/211 | |
| 1887 | J.A.Macdonald | 54/92 | 49.1% | J.A.Macdonald, 122/215 | |
| 1891 | J.A.Macdonald (Seats), W.Laurier (Vote) | 46/92 | 49.1% | J.A.Macdonald, 117/215 | |
| 1896 | W.Laurier (Seats), C.Tupper (Vote) | 43/92 | 44.9% | W.Laurier, 117/213 | Tupper wouldn't step aside for Laurier and had to be dismissed |
| 1900 | C.Tupper | 54/92 | 48.7% | W.Laurier, 128/213 | |
| 1904 | R.Borden | 47/86 | 48.4% | W.Laurier, 137/214 | |
| 1908 | R.Borden | 47/86 | 50.7% | W.Laurier, 133/221 | |
| 1911 | R.Borden | 71/86 | 53.5% | R.Borden, 131/221 | |
| 1917 | R.Borden | 74/82 | 62.3% | R.Borden, 153/235 | Borden had formed the pro-conscription Unionist Party and some pro-conscription Liberals joined |
| 1921 | A.Meighen | 36/82 | 38.8% | W.L.M.King, 118/235 | |
| 1925 | A.Meighen | 67/82 | 56.3% | A.Meighen, 115/245 | King at first continued to govern with support of Progressives, then Meighen's chance to govern didn't take |
| 1926 | A.Meighen | 53/82 | 54.9% | W.L.M.King, 116/245 | |
| 1930 | R.B.Bennett | 59/82 | 53.9% | R.B.Bennett, 134/245 | |
| 1935 | W.L.M.King | 56/82 | 42.2% | W.L.M.King, 173/245 | |
| 1940 | W.L.M.King | 56/82 | 50.3% | W.L.M.King, 179/245 | |
| 1945 | J.Bracken | 48/82 | 41.4% | W.L.M.King, 118/245 | |
| 1949 | L.St.Laurent | 55/83 | 45.1% | L.St.Laurent, 191/262 | |
| 1953 | L.St.Laurent | 50/85 | 46.0% | L.St.Laurent, 169/265 | |
| 1957 | J.Diefenbaker | 61/85 | 48.1% | J.Diefenbaker, 112/265 | |
| 1958 | J.Diefenbaker | 67/85 | 56.4% | J.Diefenbaker, 208/265 | |
| 1962 | L.B.Pearson | 43/85 | 41.0% | J.Diefenbaker, 116/265 | |
| 1963 | L.B.Pearson | 51/85 | 45.8% | L.B.Pearson, 128/265 | |
| 1965 | L.B.Pearson | 51/85 | 43.6% | L.B.Pearson, 131/265 | |
| 1968 | P.E.Trudeau | 63/88 | 46.2% | P.E.Trudeau, 154/264 | |
| 1972 | R.L.Stanfield | 40/88 | 39.1% | P.E.Trudeau, 109/264 | |
| 1974 | P.E.Trudeau | 55/88 | 45.1% | P.E.Trudeau, 141/264 | |
| 1979 | J.Clark | 57/95 | 41.8% | J.Clark, 136/282 | Clark didn't really get to do a whole lot |
| 1980 | P.E.Trudeau | 52/95 | 41.9% | P.E.Trudeau, 147/282 | |
| 1984 | B.Mulroney | 67/95 | 47.6% | B.Mulroney, 211/282 | |
| 1988 | B.Mulroney (Seats), J.Turner (Vote) | 46/99 | 38.9% | B.Mulroney, 169/295 | |
| 1993 | J.Chrétien | 98/99 | 52.9% | J.Chrétien, 177/295 | |
| 1997 | J.Chrétien | 101/103 | 49.5% | J.Chrétien, 155/301 | |
| 2000 | J.Chrétien | 100/103 | 51.5% | J.Chrétien, 172/301 | |
| 2004 | P.Martin | 75/106 | 44.7% | P.Martin, 135/308 | |
| 2006 | P.Martin | 54/106 | 39.9% | S.Harper, 124/308 | |
| 2008 | S.Harper | 51/106 | 39.2% | S.Harper, 143/308 | |
| 2011 | S.Harper | 73/106 | 44.4% | S.Harper, 166/308 |
If you didn't win Ontario, do you have to win Quebec?
List of Canadian elections of which party leader won the most seats in Quebec compared with which party leader won the most seats in Canada overall, when the overall winner did not win Ontario.| Election Year | Quebec Winner | Quebec Winning Seats | Quebec Winning Popular Vote % | Canada Winner | Notes |
|---|---|---|---|---|---|
| 1872 | J.A. Macdonald | 37/65 | 42.0% | J.A.Macdonald, 99/200 | |
| 1900 | W.Laurier | 57/65 | 56.3% | W.Laurier, 128/213 | |
| 1904 | W.Laurier | 53/65 | 55.1% | W.Laurier, 137/214 | |
| 1908 | W.Laurier | 52/65 | 53.0% | W.Laurier, 133/221 | |
| 1921 | W.L.M.King | 65/65 | 70.2% | W.L.M.King, 118/235 | |
| 1926 | W.L.M.King | 59/65 | 61.3% | W.L.M.King, 116/245 | |
| 1945 | W.L.M.King | 47/65 | 46.5% | W.L.M.King, 118/245 | |
| 1962 | L.B.Pearson | 35/75 | 39.2% | J.Diefenbaker, 116/265 | |
| 1972 | P.E.Trudeau | 56/74 | 48.9% | P.E.Trudeau, 109/264 | |
| 2006 | G.Duceppe | 51/75 | 42.1% | S.Harper, 124/308 |